Written by Doug Anderson, Allan Gregg and Hilary Martin
There are signs suggesting the race may be tightening
In the wake of the Ontario provincial budget, Earnscliffe is releasing the second wave of our weekly tracking of Ontario voter intentions. This week’s data is based on an online survey of 1,001 Ontarians of voting age conducted between April 29-May 1, 2022 and shows the Progressive Conservative Party of Ontario (PC) at 35% of decided and leaning vote, with a seven percentage point lead over the Ontario Liberal Party (OLP) (28%), while the Ontario New Democratic Party (ONDP) sits at 24%.
For the upcoming provincial election to be held on June 2nd, which party’s candidate in your local area would you be most likely to vote for? In that case, which party’s candidate in your local area would you be leaning towards? base n = 844 who are decided/leaning
Over the course of the past week, there are only small changes, none of which are statistically significant. But when compared with the results of a similar study Earnscliffe conducted in February, this current wave may be signalling a shrinking lead for the PC party. The results also show significant differences in voter support compared to the results of the last election. At 35%, the PC party is down from the 40% that delivered a majority in 2018 and into a range that would suggest a minority outcome if the numbers held through to the final results. While the Liberals enjoy much more voter support today than in 2018, NDP support is much lower.
Last week, we reported that the 38% voter share, coupled with a ten-point lead over divided opponents was in a range that often, though not always, delivers a majority of seats. Each percentage point below that, particularly when coupled with a shrinking lead, reduces the odds of a majority victory. The standings in voter support remain in a delicate range where small shifts in support can significantly alter electoral prospects.
For the upcoming provincial election to be held on June 2nd, which party’s candidate in your local area would you be most likely to vote for? In that case, which party’s candidate in your local area would you be leaning towards? base n = 844 who are decided/leaning
In our first-past-the-post system, the regional variance of voter support is essential for having a better understanding how seats might be distributed, and the results show the PC party still enjoys a lead in three seat-rich regions: the GTA (excluding Toronto itself); Southern Ontario; and Eastern Ontario. In no region does either of the two main opposition parties hold a significant lead in voter support, but the Liberals tie the PCs for the lead in Toronto and Hamilton/Niagara. The sample size in Northern Ontario is too small to rely on the lead shown.
Demographically, there are a few other striking differences that will likely influence how the campaigns and electoral fortunes evolve:
- Community size: The PCs continue to enjoy a significant lead in rural and suburban ridings, but in urban centres all three parties are virtually tied.
- Age: The PC party has a massive lead among those 55 and older and a significant lead among those 35-54. Where last week, the NDP had a significant lead among younger voters aged 18-34, the Liberals and NDP are now basically tied. With turnout often widely varying by age, this will be a key break to monitor over the course of the writ period.
- Sex: Last week, the PC led among both men and women, but the lead was larger among males. What we find this week is that the PC lead remains large among males but that lead is gone among females, among whom the PCs and Liberals both have 31% support and NDP is at 24%, down somewhat from the 30% measured last week.
This study included some additional lines of questioning to better understand what might be driving vote choice. First, we asked whether people would describe themselves more as voting for a party’s candidate or voting against one or more of the other parties. Overall, more Ontarians say they are voting for an option (54%) rather than against any other (33%). However, when examined on the basis of current vote intention, it is clear that compared to all others, Liberal supporters are more likely to say their vote is against one or more parties.
Would you say you are more voting for that party’s candidate or more voting against one or more of the other parties? base n = 844 who are decided/leaning
Respondents were also provided with a list of 17 factors and asked to identify which, if any, are particularly important to them when thinking about how they will vote. Respondents were also given the opportunity to name some other factor that was not on our list.
The results show that two factors are clearly the most broadly weighed these days:
- Policies to address affordability or the cost of living (57%); and
- Policies on health care (54%).
Several other were identified by a large number of participants, including policies on jobs and the economy (43%), policies on taxes (40%) and policies on housing (39%), but not by a majority.
For each of the possible factors listed below, please indicate which ones, if any, are particularly important to you when deciding how you will vote in the June 2nd Ontario provincial election. base n = 1,001
Looking at vote intent by these selected drivers sheds light on how voter priorities are influencing the horse race. Looking at the five most commonly selected factors shows remarkably different party standings among the groups of voters driven by one factor or another.
Among the 57% who say policies addressing affordability or the cost of living is particularly important to them, the PC party leads by 9%. The PC party has even larger leads among those 43% particularly focused on policies on taxes or policies on jobs and the economy.
Among the 54% for whom policies on health care are of particular importance, there is basically a three-way tie.
For those 39% of voters influenced by policies on housing, the three main parties are fairly close, but the NDP has a 5% advantage.
For each of the possible factors listed below, please indicate which ones, if any, are particularly important to you when deciding how you will vote in the June 2nd Ontario provincial election. base n = 1,001
Methodology
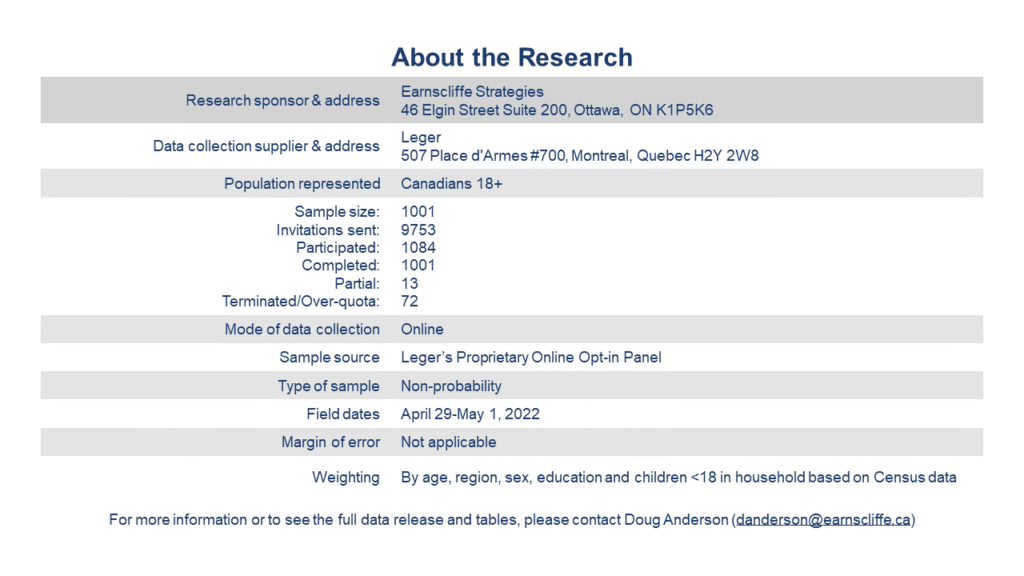
This survey was sponsored, designed and analyzed by Earnscliffe Strategies and conducted by Leger using a random sampling of panelists from Leger’s proprietary online panel. The survey was conducted with 1,001 individuals from Ontario between April 29-May 1, 2022. The data was weighted to be reflective of the Ontario population by age, region, sex, education and children under 18 in the household based on Census data. Since this survey was conducted using an online panel, no margin of error may be calculated.
Earnscliffe follows the CRIC Public Opinion Research Standards and Disclosure Requirements that can be found here: https://canadianresearchinsightscouncil.ca/standards/
View the survey questionnaire | Download the full data tables