
Making Choices in the Final Days of Election 44
In the closing days of the 44th federal election, Earnscliffe was in field to get a sense of how Canadians were weighing their choices.
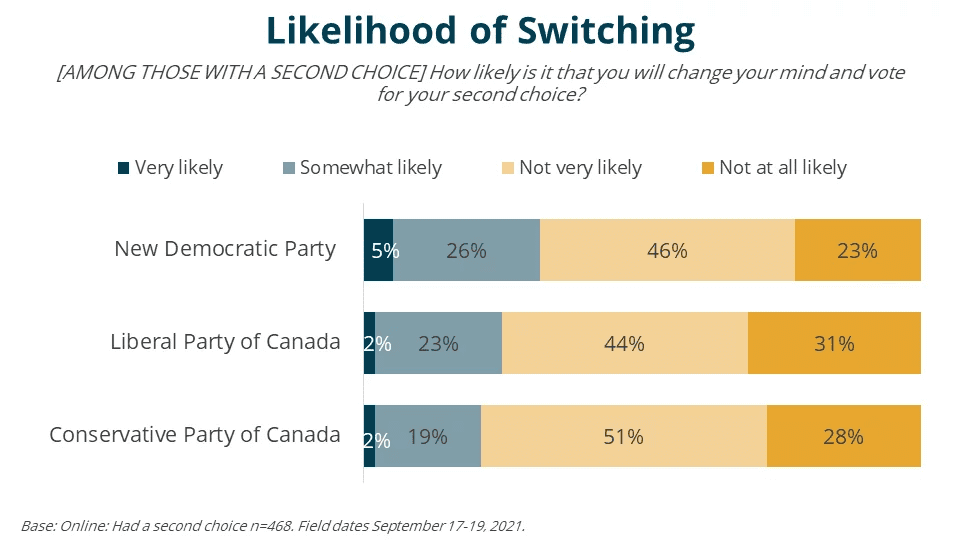
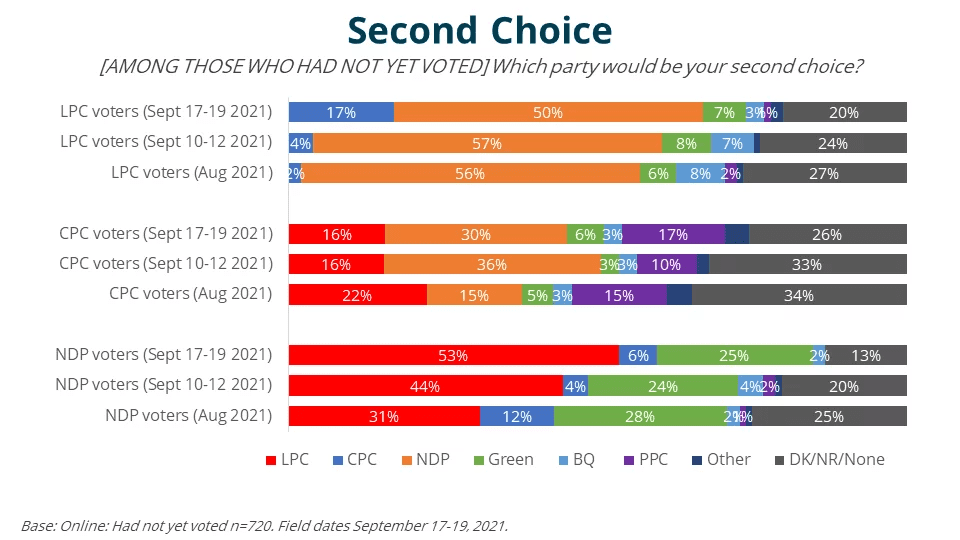
In the final days of the campaign, it remained the case that NDP supporters were most likely (31%), by a small margin, to switch their vote. If on Election Day some of these supporters did change their vote, it is likely the Liberals who gained, being the second choice of 53% of NDP voters who had yet to vote, but any switching was not significant enough to have a major impact on the final outcome.
We were also curious to find out when voters made their decision to support a particular party. Less than half (44%) claim to have decided before the election was called. One-in-five (21%) say they decided prior to Labour Day, while under a third (29%) decided in the time between Labour Day and Election Day.
Support for the Conservative Party of Canada (CPC) and Liberal Party of Canada (LPC) was locked in earliest. Over two-thirds of both CPC (69%) and LPC (70%) settled on their vote prior to Labour Day. In fact, half of each party’s supporters claim to have already made up their mind prior to the election being called. NDP voters were less likely to decide prior to the election being called (36%), but well over half (61%) claim to have decided by Labour Day.
While the sample sizes for both parties are small and should be treated with caution, BQ and PPC voters were the most likely to decide in the final weeks of the campaign. Over a third of BQ (38%) and 42% of PPC supporters say they decided between Labour Day and Election Day.

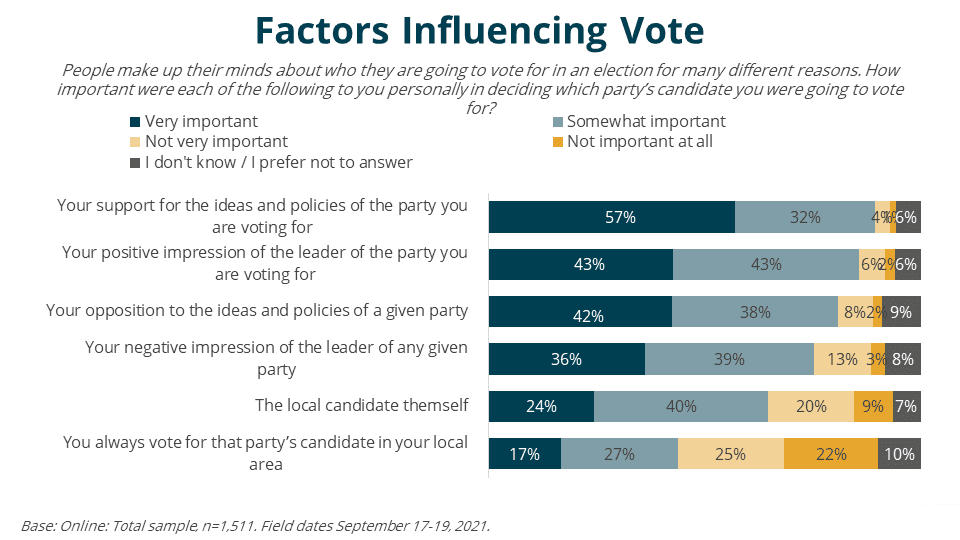
To get a sense of the undercurrents driving each party’s supporters to vote for them, we asked voters a series of questions aimed at determining how important support for versus opposition to a party or leader is, as well as the local candidate and habit of voting for a given party.
For almost each of the factors tested, over half of voters say that it is very or somewhat important to their vote decision. Support for the ideas and policies of the party they are planning to vote for is highest in importance (89% very/somewhat), followed by positive impression of the party’s leader (86%). Opposition to any given party’s policies (80%) and negative impression of a leader (75%) are not far behind. The local candidate (64%) and habit (44%) are less significant factors.
On balance, all of these factors are significant to vote choice, regardless of political affiliation, but CPC supporters do seem to be more equally motivated by support for party policies and the leader as they are by opposition to a party or leader, whereas NDP and LPC supporters claim that support for their party’s policies and positive impressions of the leader have a greater impact. Among CPC voters, 54% say their support for the party’s policies is very important. Opposition to other parties’ policies is not far behind at 51%, followed by negative impressions of another party’s leader (48%). In contrast, 63% of LPC and 68% of NDP voters say their support for their respective parties’ policies is very important, followed by positive impression of the leader of the party they support (48% and 50% respectively). Roughly equal proportions of LPC and NDP voters say their opposition to other parties’ policies is very important (43% and 42% respectively). Liberals are more likely to say negative impressions of other party leaders is very important to their vote choice (36%) than NDP voters (28%).
To the extent that CPC voters are motivated by negative impressions of a leader or party, it seems that Justin Trudeau’s Liberals are who they are most motivated to vote against, followed by Maxime Bernier and the PPC. In contrast, for LPC and NDP voters who claim that negative impressions of a leader or party are important to their vote, Erin O’Toole and the CPC, along with Maxime Bernier and the PPC seem to be the leaders and parties they are most often opposed to and motivated to vote against.


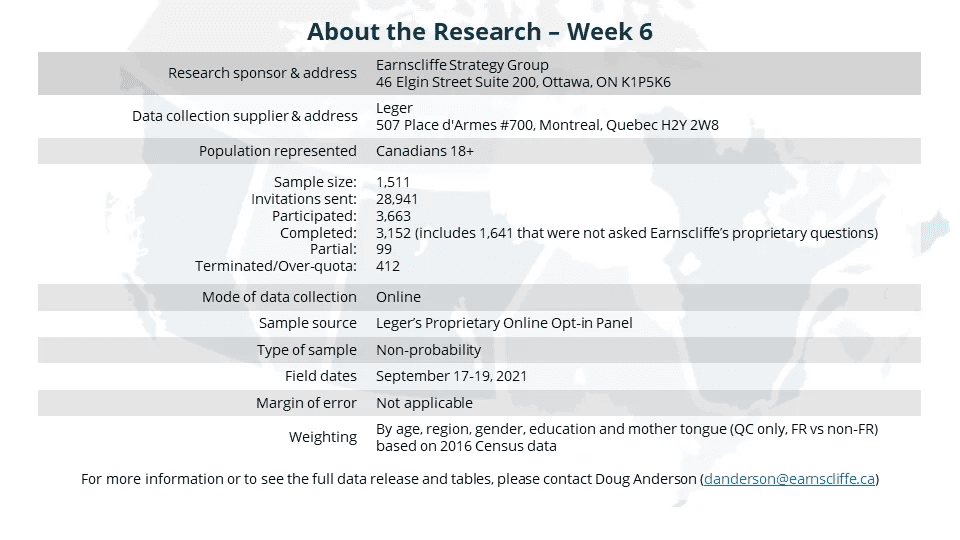
This survey was sponsored by Earnscliffe Strategy Group and conducted by Leger using a random sampling of panelists from Leger’s proprietary online panel. The survey was conducted with 1,511 individuals from across Canada between September 17 and 19, 2021. The data was weighted to be reflective of the Canadian population by age, region, gender, education and mother tongue (QC only, FR vs non-FR) based on 2016 Census data. Since this survey was conducted using an online panel, no margin of error may be calculated.
Earnscliffe follows the CRIC Public Opinion Research Standards and Disclosure Requirements that can be found here: https://canadianresearchinsightscouncil.ca/standards/
View the survey questionnaire | Download the full data tables