Written by Doug Anderson, Allan Gregg and Hilary Martin
Status quo (for now)
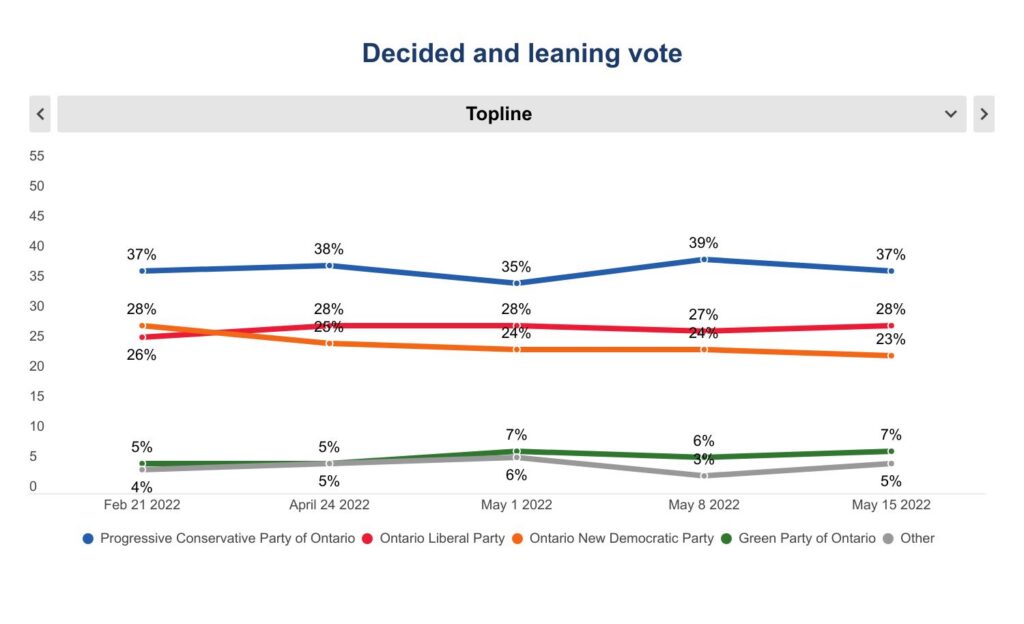
Mid-way through the election campaign, topline vote intention looks a lot like it did three weeks ago
As we near the mid-way point of the Ontario provincial election, topline vote intention is much the same as it was at the outset of the campaign. The Progressive Conservative Party of Ontario (PCs) leads with 37% of the decided and leaning vote, followed by the Ontario Liberal Party (OLP) at 28%, the Ontario New Democratic Party (ONDP) at 23% and the Green Party of Ontario at 7%.
To see how each party fares by sex, age, area, and region, use the drop-down menu in the chart below.
The relative stability of the topline numbers hide some regional shifts that have been occurring and which may ultimately be material to seat distribution. In Metro Toronto, the Liberals have regained a slight advantage over the PCs (38% vs 35% respectively), while the NDP trails at 21%. The PCs continue to lead in the rest of the GTA with 44% of the decided and leaning vote, compared to the Liberals at 28% and the NDP at 17%, as well as Southern Ontario (PC 45%, OLP 14%, NDP 22%). In Eastern Ontario, the Liberals now lead with 35%, followed by the PCs (28%) and then the NDP (25%).
The PC’s lead among voters ages 18-34 we noted last week has disappeared, and now the Liberals lead that segment with 38% of the vote, a 12-point lead over second place NDP (26%). The PCs continue to lead among voters ages 35-54 and 55+. If these numbers hold true and assuming that voter-turnout is lower among voters younger than 35, then the effect may be that the votes that actually get cast can be a few points higher for the PCs than these polls imply.
Among female voters, 35% say they would vote for the PCs, 28% the Liberals and 25% the NDP. Among male voters, 38% would vote PC, 29% would vote Liberal and 21% would vote NDP.
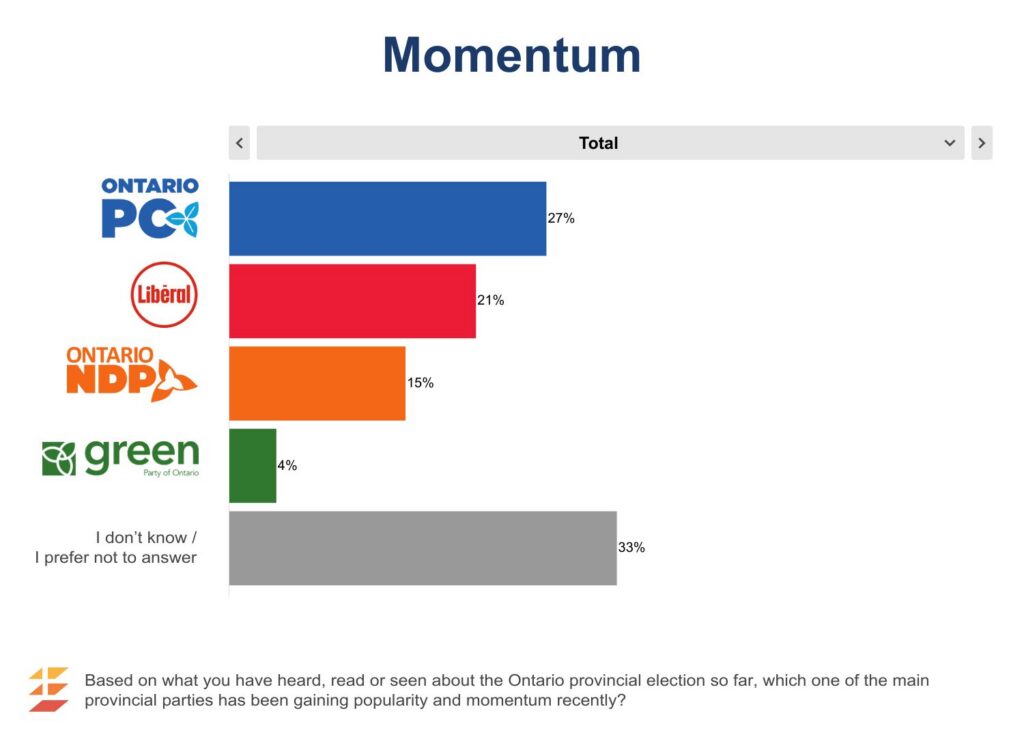
To get a better sense of voters’ impressions of which party is ahead/behind, we asked respondents which of the main provincial parties they felt was gaining momentum. Notably, a third (33%) are not sure or do not offer an answer, suggesting that many are not following the campaign closely. About a quarter (27%) say the PCs are gaining momentum. One-in-five (21%) say the Liberals, 14% the NDP and 2% the Greens. For most the most part, results are highly correlated with current vote intention. Over half of PC (60%) and Liberal (56%) voters believe their party is gaining momentum. NDP voters are less bullish about their party’s changing fortunes, though still 44% say the NDP is gaining momentum.
We also investigated the issue of “affordability and cost of living”, specifically asking how important a consideration it will be for how one will vote. There is a massive consensus that crosses all partisan and regional lines that this issue is not only important to everyone’s vote decision, a clear majority describe it as very important.

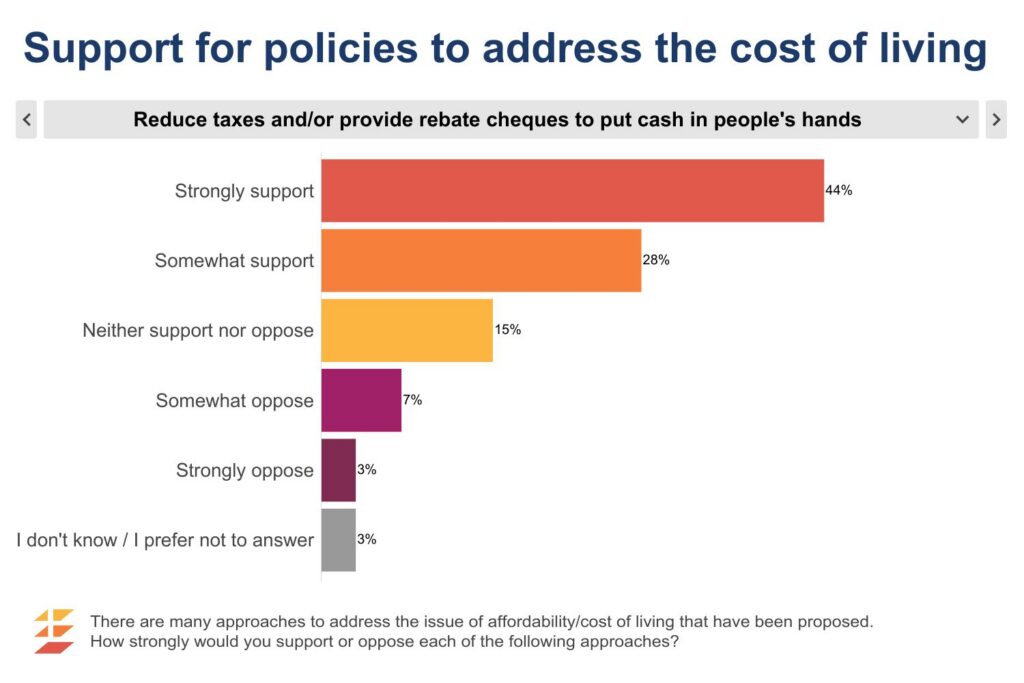
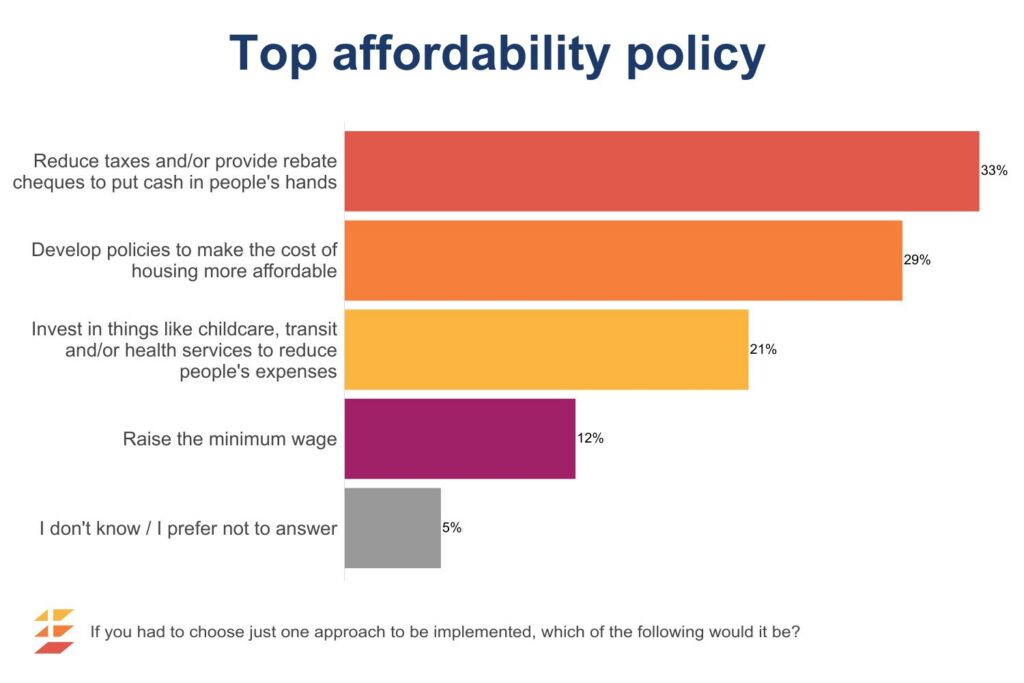
We tested the level of support for each of four, somewhat contrasting, policy approaches to addressing the issue of affordability and cost of living:
- Reduce taxes and/or provide rebate cheques to put cash in people’s hands;
- Invest in things like childcare, transit and/or health services to reduce people’s expenses;
- Develop policies to make the cost of housing more affordable; and
- Raise the minimum wage.
The responses show that at the moment, Ontarians show almost no distinction between the various approaches, with strong majorities supporting each of these approaches. The interpretation from this is that Ontarians see this as a crisis and have a strong appetite to see something – anything – done and may not be weighing the trade-offs associated with each approach.
When forced to choose among the four approaches, few opt for the idea of raising minimum wage, but there is much greater division of opinion over the three other options. This holds true across all regions and for the most part, even across partisan lines. Among those who are currently intending to vote PC or for some other party, there is more consensus around the approach that puts cash in peoples’ pockets either through tax cuts or rebates, but it is by no means unanimous. In fact, half (49%) of PC’s current voters say they would prefer one of the other three approaches.
Methodology
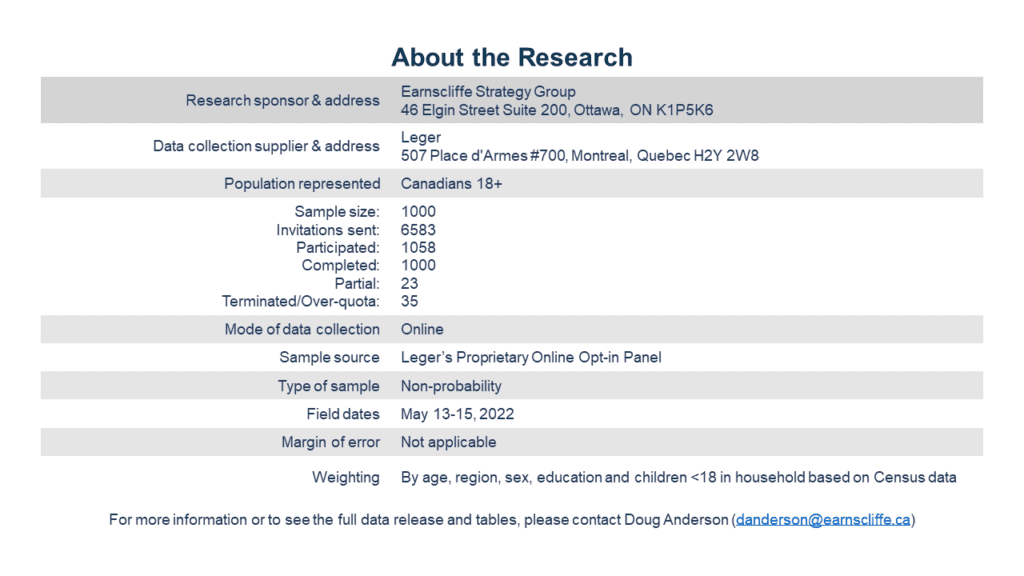
This survey was sponsored by Earnscliffe Strategies and conducted by Leger using a random sampling of panelists from Leger’s proprietary online panel. The survey was conducted with 1,000 individuals from Ontario between May 13 to 15, 2022. The data was weighted to be reflective of the Ontario population by age, region, sex, education and children under 18 in the household based on Census data. Since this survey was conducted using an online panel, no margin of error may be calculated.
Earnscliffe follows the CRIC Public Opinion Research Standards and Disclosure Requirements that can be found here: https://canadianresearchinsightscouncil.ca/standards/
View the survey questionnaire | Download the full data tables