Written by Doug Anderson, Allan Gregg and Hilary Martin
PCs gain momentum in final days of Ontario provincial election campaign
As we enter the last days of the Ontario provincial election, our weekly tracking suggests that a majority – while not guaranteed – is well within reach for the Progressive Conservative Party of Ontario (PCs). The PCs lead with 39% of the decided and leaning vote (up 3 points from last week), followed by the Ontario Liberal Party (OLP) at 26% (down 2 points from last week), the Ontario New Democratic Party (NDP) at 24% (unchanged) and the Green Party of Ontario at 5% (down 1 point).
To see how each party fares by sex, age, area, and region, use the drop-down menu in the chart below. Note that some sample sizes are small, and results should be interpreted with caution.
After tightening slightly last week, the PCs have regained ground from the Liberals in suburban Ontario, which could prove essential to their chances of forming a majority government. At 41%, the PCs lead the Liberals by 15 points and the NDP by 17 points in these key suburban areas across the proviince. The PCs also continue to lead in the GTA outside Metro Toronto, with 38% of the decided and leaning vote compared to 32% for the Liberals and 23% for the NDP. In Metro Toronto, the PCs and Liberals are statistically tied at 37% and 36% respectively, while the NDP continues to trail at 20%.
The PCs also continue to lead among older (and traditionally voters with the highest turnout rate) segments of the population. Among those 55+, 46% say they will vote PC, 23% for the Liberals and 17% for the NDP. Among those 35-54, 41% intend to vote PC, 26% intend to vote Liberal and 24% say they will vote for the NDP. The PC lead among men is 19 points, and among women, 5 points.
The PC’s stable lead over the course of the campaign is reflected in the small percentage of Ontarians who say they’ve changed their mind about which party to vote for in the past few weeks – just 13%.
With the PCs leading in the polls consistently over the course of the campaign, much attention has been turned to the race for second place between the NDP and the Liberals. The current 2-point gap between them is within the margin of error. Neither party has managed to solidify a lead, and it is unclear which will come away with the most seats on Election Night.
Two weeks ago, we asked voters which party they felt was gaining popularity and momentum. At the time, 27% said the PCs, 21% the Liberals and 15% the NDP. We revisited that question this week, and found 32% believe the PCs are gaining momentum, up 5 points, while impressions of the Liberals’ momentum have softened to 15%. Momentum ratings for the NDP are virtually unchanged at 16%. However, significantly, more NDP voters remain are convinced of their party’s momentum than Liberals voters. Among NDP supporters, 45% say their party is gaining momentum, unchanged from two weeks ago. In contrast, just 38% of Liberal voters feel their party is gaining, down from over half (56%) two weeks ago. To the extent that the impression of momentum could motivate volunteers and voters, this data could signal a potential turnout issue for Liberals.
Finally, to get a sense of where support may have shifted from one party to another over the past 4 years, we asked respondents who they voted for last election. Almost two-thirds of current PC voters say they voted for that party in 2018, while 12% say they voted Liberal and 6% NDP. Among NDP and Liberal voters, the majority also say they voted for their respective parties in 2018. However, there’s clearly more trading of votes between these two parties. Almost 1 in 5 (19%) current NDP supporters claim to have voted Liberal in the last provincial election, while 17% of current Liberals say they voted NDP. The relative fluidity between these two sets of voters, compared to PC voters, further adds uncertainty to the question of which will end up in second place.

Methodology
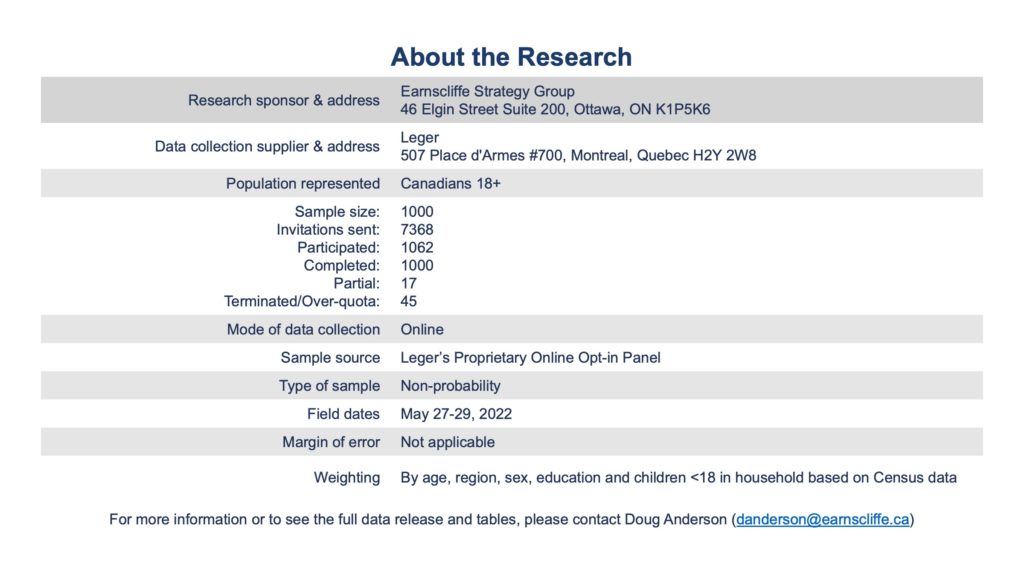
This survey was sponsored by Earnscliffe Strategies and conducted by Leger using a random sampling of panelists from Leger’s proprietary online panel. The survey was conducted with 1,000 individuals from Ontario between May 27 to 29, 2022. The data was weighted to be reflective of the Ontario population by age, region, sex, education and children under 18 in the household based on Census data. Since this survey was conducted using an online panel, no margin of error may be calculated.
Earnscliffe follows the CRIC Public Opinion Research Standards and Disclosure Requirements that can be found here: https://canadianresearchinsightscouncil.ca/standards/
View the survey questionnaire | Download the full data tables

