Written by Doug Anderson, Allan Gregg and Hilary Martin
Despite three weeks of official campaigning, topline vote intent has barely shifted
As we enter the last leg of the Ontario provincial election, our weekly tracking suggests that the campaigns have had very little impact on voting choice. With 18% of the electorate saying they have already cast their ballot, The Progressive Conservative Party of Ontario (PCs) leads with 36% of the decided and leaning vote (down 1 point from last week), followed by the Ontario Liberal Party (OLP) at 28% (unchanged from last week), the Ontario New Democratic Party (ONDP) at 24% (up 1 point) and the Green Party of Ontario at 6% (down 1 point).
To see how each party fares by sex, age, area, and region, use the drop-down menu in the chart below.
The relative stability of the topline numbers hides some regional shifts that have been occurring and which may ultimately be material to seat distribution. Perhaps most importantly, our data suggests that there has been some province-wide tightening in suburban Ontario where the PCs have gone from an 11-point lead over the Liberals (in February 2022) to a 5-point lead. This same trend is reflected in the GTA, outside of Toronto, where the PC lead over the Liberals has shrunk from a high of 19 points to 7.
In Metro Toronto, this week’s polling indicates that the NDP have lost 6 percent since May 1st, are now running a poor third and are 15 and 14 points behind the PCs and Liberals, respectively, who are in a statistical tie for the lead. The one geographic glimmer of hope for the New Democrats is in the Hamilton/Niagara region where they have increased their vote by 12 percent and are now leading. The Southern region has also shown some tightening, although the PCs are still 11 and 14 points ahead of the NDP and Liberals respectively. Finally, the PCs have opened a 20-point lead over both the Liberals and NDP in their traditional strong hold of Eastern Ontario.
Liberal gains noted among voters ages 18-34 over the first three weeks have been reversed and the NDP are now ahead among this cohort. Otherwise, the PCs continue to lead among voters ages 35-54 and 55+. Supporting the thesis that this support among middle aged and older voters may give the PCs a turnout advantage over the Liberals and NDP, we also noted this week that the Tories’ province-wide lead of 8 percent expands to 12 when considering voters who maintained that they have voted in “all” of the elections where they were eligible, whereas Liberal voters show just average historic turnout rates and the NDP vote is higher among those who vote less regularly.
Interviewing for this week’s survey took place almost after the last debate. Consistent with our top line numbers, our findings this week suggest that the Leader’s television exchange did little to alter the momentum, direction or possible outcome of this election. Indeed, only 10 percent of the voting population reported watching the entire debate and an additional 19 percent claimed they watched part. In the age of social media however, we have come to learn that voters no longer gather political information, in the moment, from legacy platforms. Notwithstanding these low television ratings, almost a third of the electorate saw, heard or read “news” about the debate and over one-in-five either picked up information from social media (12%) or talked or messaged about the debates through social media posts (9%).
Reflecting the “flatness” of the tracking data, part of the conventional wisdom of this campaign centers around the contention of voter apathy and disinterest. Our findings suggest otherwise.
The majority of voters (54%) report that their interest in this election is “the same” as it has been in the past and slightly more (22%) claim that they are more interested than usual rather than less (19%). Similarly, a slightly larger segment of the voting population offer that they are following the campaign either very (15%) or somewhat closely (37%) compared to those who report that they are following it either not very closely (33%) or not at all (13%).
The reason for this seems to be that – even if they are not particularly enthusiastic about the choices offered – voters have a fundamental understanding that elections matter – and not just for the political parties but for them as well. Almost two-thirds (63%) say this election will affect their future, and over-two thirds believe this election is important.
Methodology
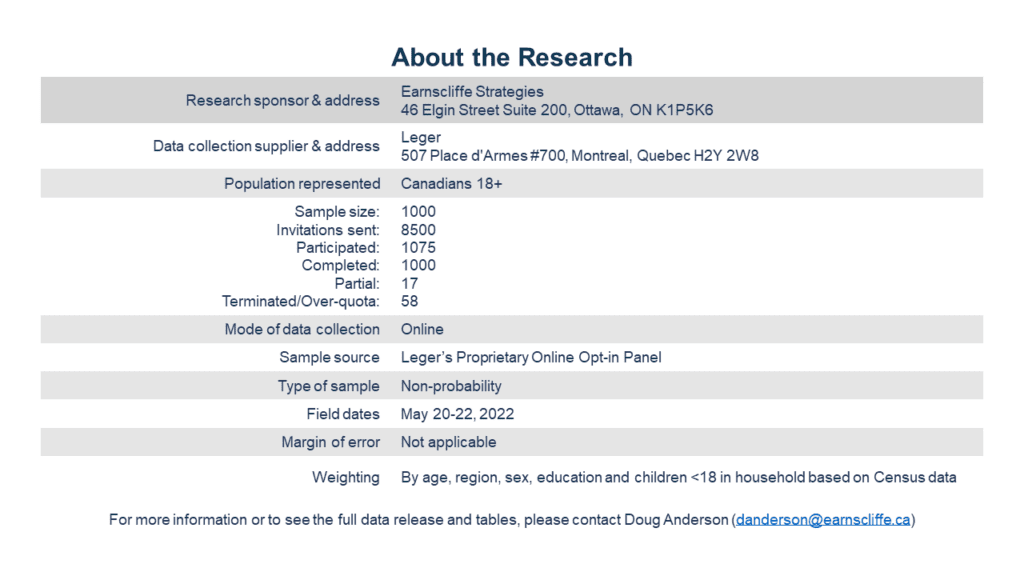
This survey was sponsored by Earnscliffe Strategies and conducted by Leger using a random sampling of panelists from Leger’s proprietary online panel. The survey was conducted with 1,000 individuals from Ontario between May 20 to 22, 2022. The data was weighted to be reflective of the Ontario population by age, region, sex, education and children under 18 in the household based on Census data. Since this survey was conducted using an online panel, no margin of error may be calculated.
Earnscliffe follows the CRIC Public Opinion Research Standards and Disclosure Requirements that can be found here: https://canadianresearchinsightscouncil.ca/standards/
View the survey questionnaire | Download the full data tables