By Allan Gregg and Hilary Martin
Like virtually all the other publicly available polls, our own Earnscliffe nation-wide research shows the Liberals and Conservatives locked in a virtual dead heat. Moreover, regional results compared to the actual vote in 2015 similarly suggest that neither major party has a clear pathway to majority government.
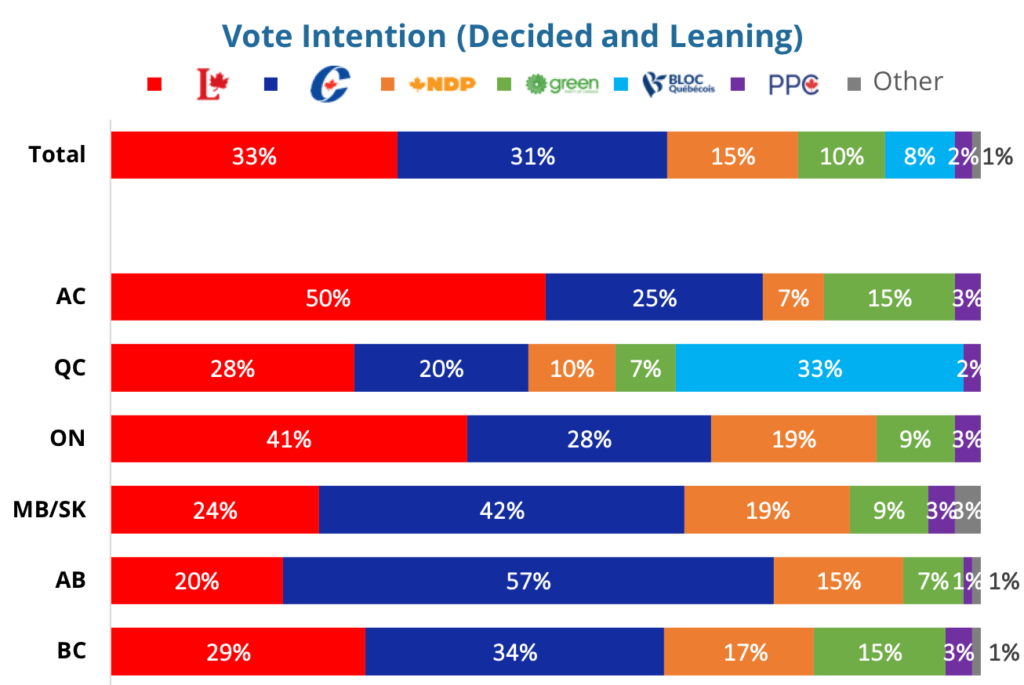
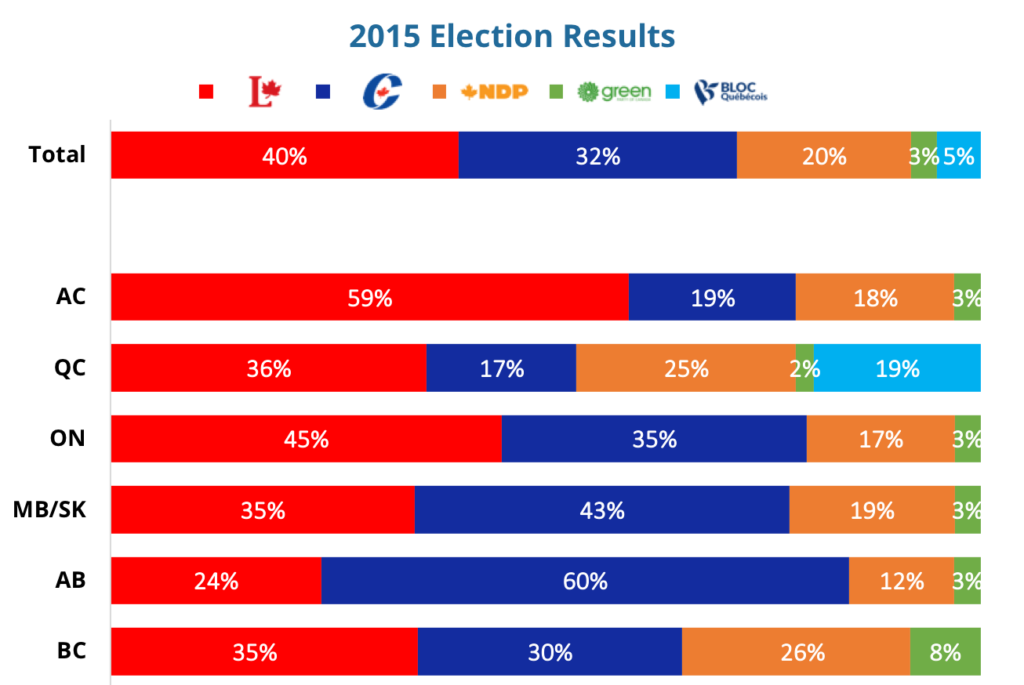
Compared to 2015 results, both the Liberals and the NDP have lost support in Atlantic Canada but the Liberal lead continues to be commanding and suggests only minor seat changes in the region. Similarly, the NDP and Liberals are polling much lower in Quebec (down 15% and 8% respectively since 2015) but this has added only 3 points to the Conservatives 2015 total, suggesting that the BQ may be the only party with potential to pick up any number of significant seats in the province. In Ontario, both the major parties are down in support to the benefit of both the third parties, but the Liberal lead over the Conservatives (+13%) is only slightly lower than it was in 2015 (+20). Current voting intention in the Prairies looks fairly similar to 2015 results, although the dominance of the Conservatives, together with the Liberal declines in Manitoba/Saskatchewan would indicate modest gains for the Conservatives. As is often the case, these results suggest that the election may be won or lost in British Columbia, where both the NDP and Liberals are down (by 11 and 4 points respectively) while the Green Party is polling 7 points more than in 2015 and the Conservatives are up by 4.
So, is this – as some have suggested – a “Seinfeld election”, where nothing happens or is it possible that voting patterns can shift over the next two weeks and produce a result that none of us foresee at this point in time?
A volatile and porous electorate
A deeper analysis of voter sentiment reveals just how volatile the Canadian electorate could be. Indeed, for all the talk of partisan polarization, our research indicates that not only is it possible for either the Conservatives or the Liberals to form a government in Canada but both the Green Party and the NDP have the potential to double their current levels of support.
Indeed, when asked if they would “definitely, probably, probably not or definitely not” consider voting for each party, approximately half of the voting population do not rule out the possibility of voting for any of the available options. The exception is the People’s Party – almost two-thirds claim they would “definitely not” be inclined to make that choice.
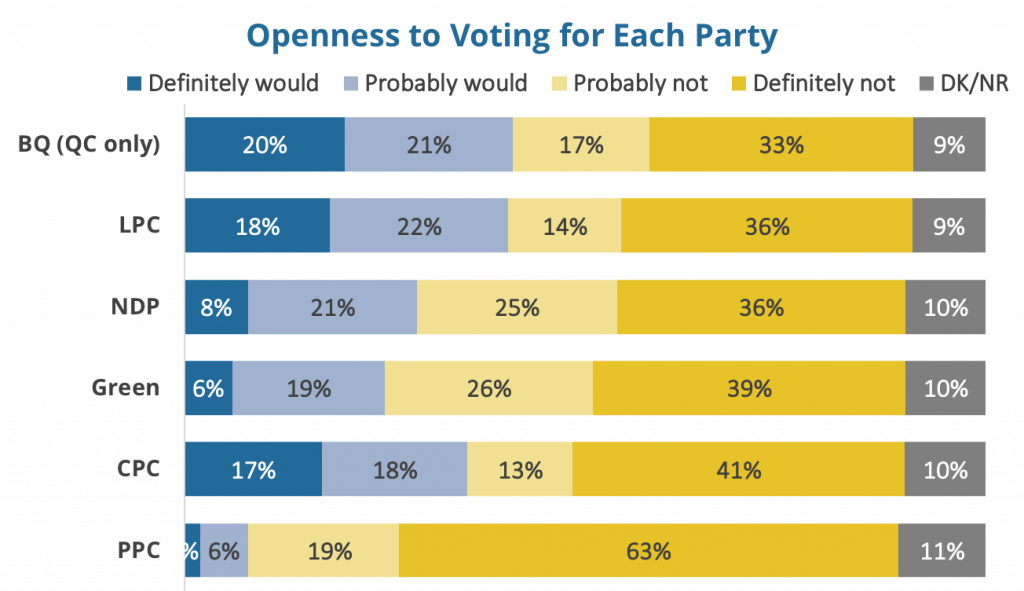
Above and beyond this overall tendency, of the major parties, the Liberals have a potential base of support that is 5 points larger than the Conservatives, and they also have 8% more voters who would “definitely not” consider the CPC. Displaying their resurgence in Quebec over the last short period of time, the BQ has the largest available pool of support of all parties at 41%.
Moreover, among those who are prepared to consider each of the four main parties (the Liberals, Conservatives, NDP and the Greens), at least one-third are also prepared to consider voting for another party, and in the case of the NDP and Green considerers, over a third are prepared to consider voting for as many as three other alternatives. Of particular significance: by a ratio of almost 2 to 1, these third-party considerers tend to be more open to voting Liberal than Conservative.
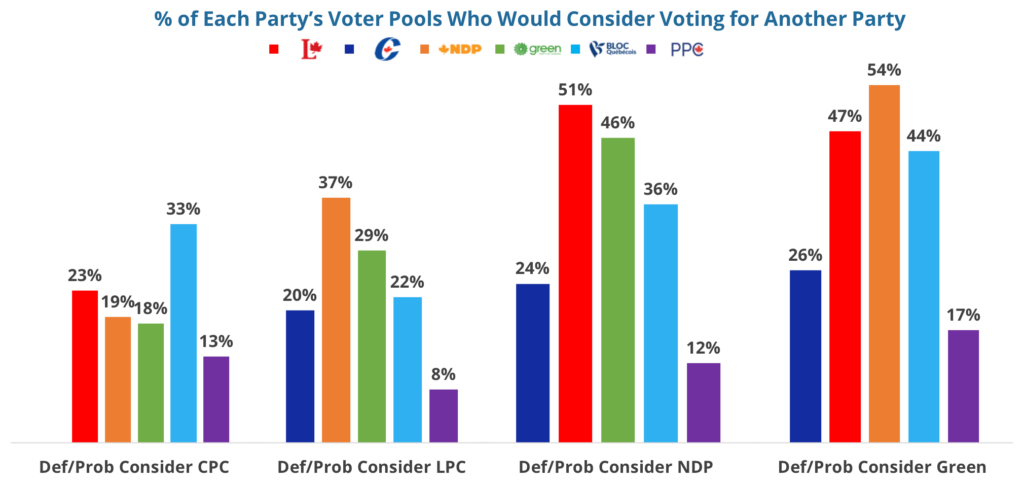
These results reveal that not only does the electorate have the potential to be volatile, but that partisan preference is also extremely porous with most voters willing to consider other options available to them. Moreover, this porousness is particularly evident for those voters who are most likely to consider a center-left or third-party options.
Voter re-alignment since 2015
When we analyze what has happened to voter choice since 2015, the full extent to which Canadian voters are prepared to consider other options and to switch their partisan preference becomes apparent.
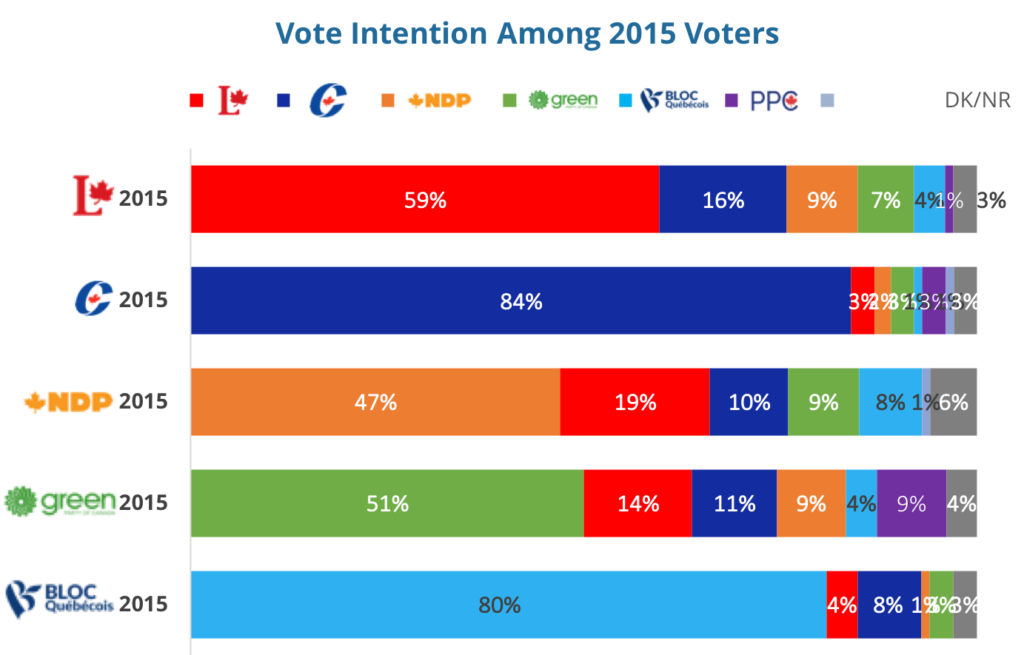
As the table above shows, only the Conservatives (84%) and the BQ (80%) have been able to retain most all of their 2015 base. The Liberals have retained fewer that 6 out of 10 of the voters who supported them in the last election. Put another way, the Liberals have lost 41% of the base that gave them a majority government four years ago. The Green Party and the NDP have experienced even larger losses, with half of their 2015 supporters currently voicing a preference for a different party. Overall, these collective changes suggest that slightly over 1/3rd of all Canadian voters currently intend to vote for a different party than they supported in the last federal election.
Further reflecting the partisan porousness cited above, no single party has been the beneficiary of this massive re-alignment, but the Liberals have clearly been the least able to pick up new supporters.
One-quarter of the current Conservative support base is made is made up of 2015 Liberal voters. As a portion of their total vote, the NDP and the Green Party have been able to pick up even a larger share of disaffected Liberal supporters – 30% and 40% respectively. However, NDP gains have been off-set by losses since 2015 to the Green Party (17% of their current base) and the BQ (16%); but also to the Liberals (9%) and even the Conservatives (6%). In other words, while the NDP may have benefited from the erosion of Liberal support over the last 4 years, at the same time they have lost significant portions of their 2015 base to all parties. The Green Party has experienced a similar but less acute pattern of re-alignment. They have picked up Liberal votes (40% of their current base) but have also bled former voters to the other parties.
In many ways, the party that has benefited the most from this post-2015 realignment has been the BQ. Only half of their current supporters voted BQ in 2015, with the remainder comprised almost entirely of former Liberal (21%) and NDP (16%) voters.
So … what could happen in the next ten days?
What these results indicate is that those following Canadian politics should never discount the possibility of massive change – even if none appears to be occurring right now. In other words, in modern Canadian elections, “it ain’t over until it’s over”
The table below simply confirms that maxim. Almost one-third of currently decided voters posse a second choice and say that it is at least “somewhat” if not “very likely” that they may switch to that second choice between the time of interviewing and election day.
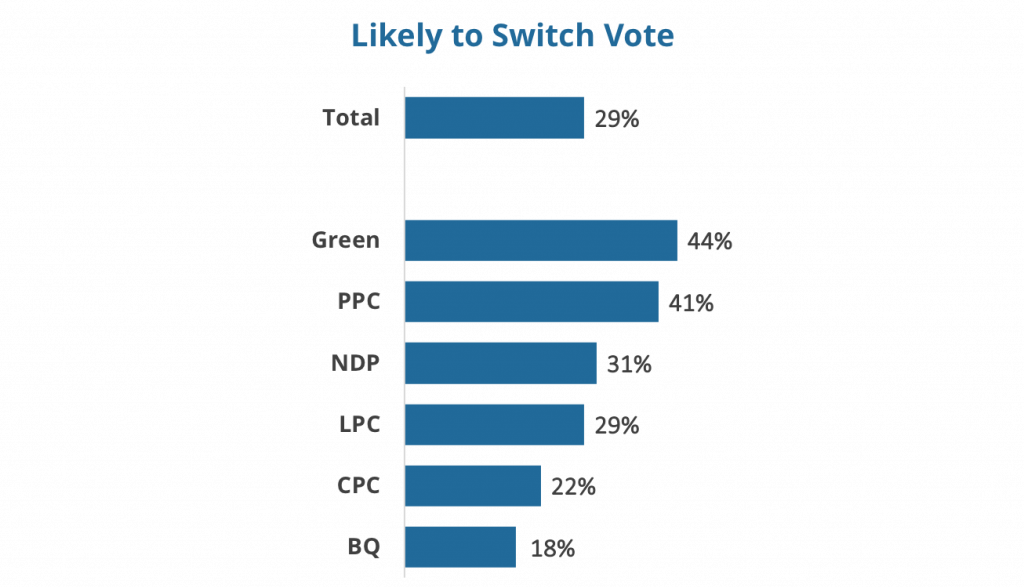
The Conservatives’ (22% possible switchers) and especially the BQ’s (18% possible switchers) vote are decidedly “harder” than the Liberals (29% possible switchers). Combining these results with the previous analysis of the size of each party’s voting pool, it is clear that while the Liberals have more potential to grow than the Conservatives, they also have more possibility to shrink by losing a larger share of second choice support. In other words, the Liberals have a higher ceiling of support than the Conservatives but they also have a lower floor. In contrast, the BQ have not only the highest ceiling but also the lowest floor, making their support both more stable and potentially upwardly fluid than either of the major parties.
In contrast, the third and minor parties not only have significantly smaller pools of voters available to them, they are also far more likely to lose the support they already have to the Liberals, Conservatives or BQ.
So … if further voter re-alignment were to occur, what is most likely to happen?
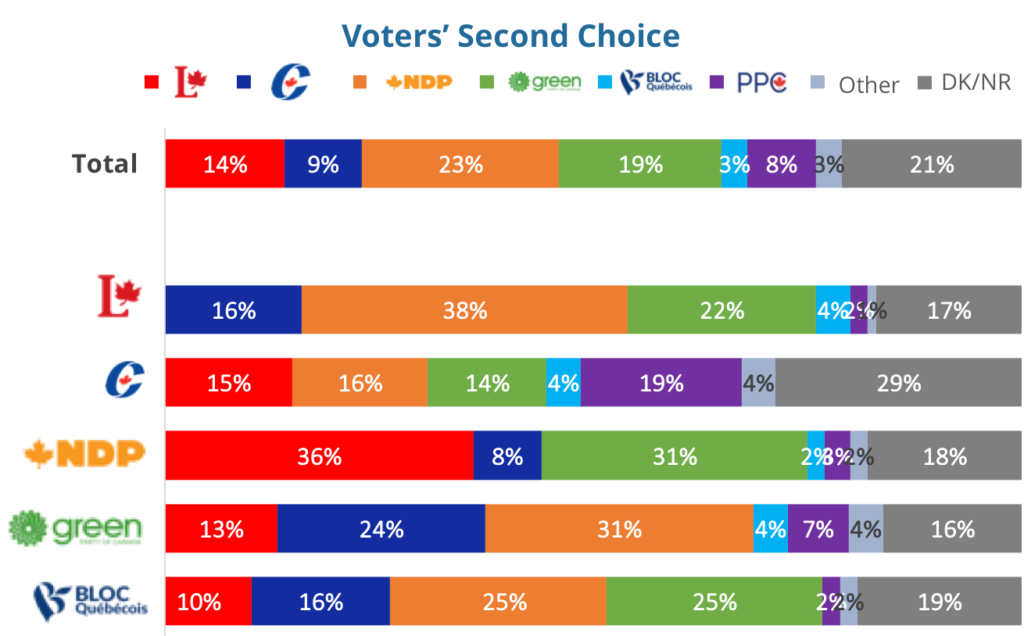
As the above table demonstrates, neither of the main contenders in this election stand to gain much by trying to suppress the other’s vote; as only about 1 in 6 of current Conservative voters are likely to gravitate to the Liberals as their second choice and visa versa. Rather, if the Liberal vote were to erode, it would be far more likely to be to the benefit of the NDP and even the Green Party than the Conservatives. Similarly, if the Conservatives were to experience losses it would benefit any of the People’s Party, the NDP or the Green Party as much as the Liberals. In other words, if either the Liberal or Conservative vote were to decline over the next two weeks, support for third parties (other than the BQ) would rise faster and higher than it would for their main opponent.
This same basic pattern appears in the current BQ voter base. If they were to experience a set-back in support, defecting BQ voters would gravitate to the NDP and Green Party in approximately twice the numbers as would switch to the Liberals or Conservatives. Moreover, while the differences are not massive, these results also suggest that were the BQ vote to collapse, it would benefit the Conservatives more than the Liberals. In many ways then, the BQ may present the biggest roadblock to any prospective pathway to a renewed Liberal majority. At their current levels, the BQ are set to win new seats, thereby robbing the Liberals of the opportunity to pick up ridings in Quebec to offset seats they might lose elsewhere. Conversely, any suppression of the BQ vote will benefit all other parties more than the Liberals.
At 10% current national support, Green Party second choice does not really factor into any significant recalculation of possible voter re-alignment. If their voters were to defect, the NDP would benefit the most, but only to the upward-most possibility of 3% of the total popular vote. Similarly, a complete collapse of the Green Party would only add 1% to the Liberals and 2% to the Conservatives popular vote.
What happens to the NDP vote over the next two weeks on the other hand, could have a major impact on the election outcome. If their voters were to defect, the Green Party have a potential to pick up slightly under one-third of their second choice but the Liberals stand to gain even more (36%). Therefore, if the BQ presents the greatest roadblock to Liberal victory, then the NDP offers the greatest opportunity.
Finally, an analysis of second choice underlines a major part of the Conservative’s dilemma over the next two weeks. Not only do they have very little to gain by trying to shake votes away from their main Liberal competitor, but they have virtually no second choice support among NDP voters, and Green second choice is really too small to make much of a difference in the election outcome. Indeed, their single greatest opportunity to re-align the vote may be available by attacking the BQ; but they would have to do this knowing that, if successful, it would benefit the NDP even more than them, thereby also possibly helping the NDP regain Quebec seats that may be currently lost. Faced with navigating this dangerous terrain, the Conservatives best route to victory in the last two weeks may be found by attempting to galvanize their base in order to gain a turnout advantage over the Liberals.
Taken together, these results suggest that while the electorate is volatile and partisanship is porous, there is no loadstar on which major change is likely to occur in a single, defining direction. For the time being, the Liberals appeared to stymied by the BQ in Quebec. The Conservatives have the least room to grow nationally. Even though their vote is extremely stable, the BQ seems to have neared the apex of their support. The NDP and Green parties have the most room to grow but they are also most likely to get squeezed and lose support should the electorate decide to vote strategically. The only thing that seems absolutely certain is that Maxime Bernier and the new People’s Party will not have the impact on this election that they hoped.
Earnscliffe is pleased to present the results of our latest survey of the Canadian electorate. In this Special Bulletin of Earnscliffe’s Election Insights, we share insights on what could still happen in this election; how to leverage leadership; and, how (if at all) voters are considering the parties’ electoral promises.
In the coming days, we will share further insights on the issues influencing voters’ choices as well as other topics covered in the survey.
About our survey (Methodology): The results are based upon an online survey of 1,756 eligible Canadian voters randomly recruited through the use of the Leger Opinion (LEO) online panel. The survey was conducted between October 1st and 6th, 2019. Using data from the 2016 Census, results were weighted according to age, gender and region in order to ensure sample reflective of the population. As this was a non-probability sample, no margin of error can be associated with the results, nor is it appropriate to offer any comparative margin of error indicating the level of accuracy of results had the study been conducted using random probability sampling.
