CPC, LPC remain tied with less than a week until Election Day
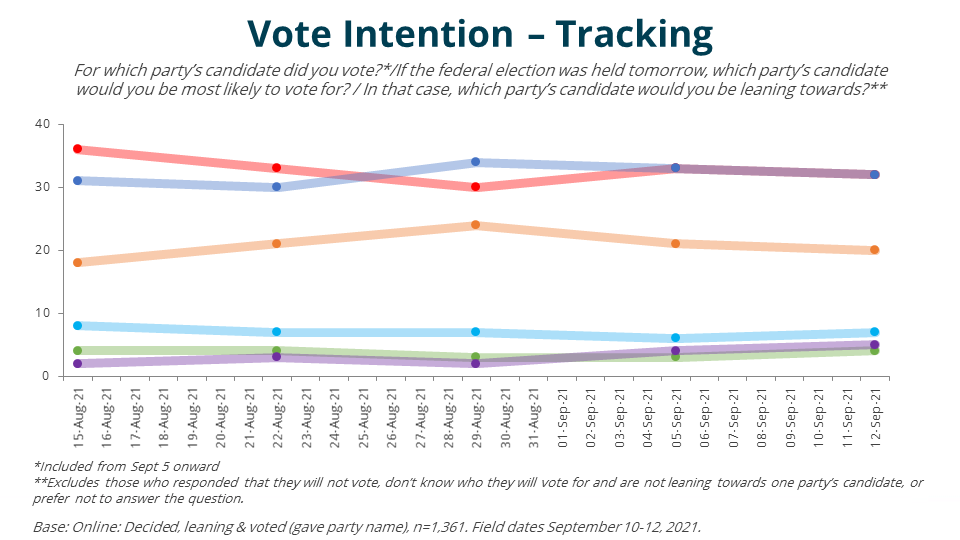
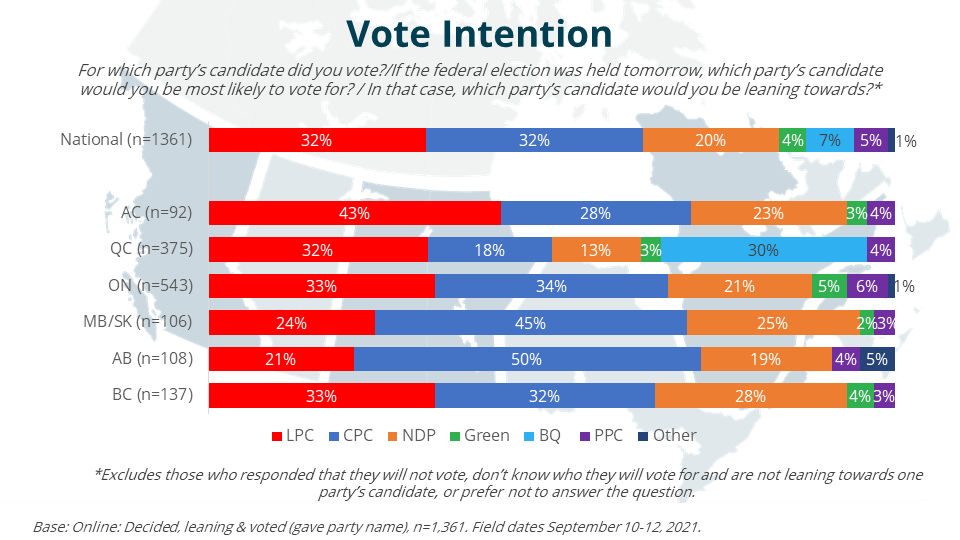
Less than a week from election day, our data continues to show a tie between the Conservative Party of Canada (CPC) and the Liberal Party of Canada (LPC). Their support remains virtually unchanged at 32% each. NDP support has declined over the last two weeks, from 24% in our survey conducted between August 27 and 29 to 20% nationally in our most recent study.
With the national results so close between the top two contenders, examining the regional numbers is important to help understand which party might end up with the most seats. In Ontario, the Conservatives and Liberals remain in a statistical tie, at 34% and 33% respectively. The Conservative number is not far off what they earned on election night in 2019 (33%) but the Liberals are polling 9 points lower. Meanwhile, NDP support remains higher (21%) than it was in October 2019 (17%), and support for the People’s Party of Canada (PPC) is at 6%, compared to just 2% in 2019. Both the Conservatives and the Liberals will likely need to build support in Ontario to have a chance of forming government, but while the NDP and PPC remain stronger than they were in 2019, this could prove challenging.
In Quebec, the Liberals are down from 36% last week to 32% this week, and the Bloc Québécois are up slightly from 27% to 30%. The CPC remains almost unchanged at 18%, as does the NDP at 13%. Compared to 2019, the CPC and NDP are polling slightly higher (they received 16% and 11% respectively), and the Liberals and the BQ, who garnered 34% and 32% of the vote each, slightly lower.
The race in BC remains competitive between the Liberals (33%), the Conservatives (32%) and the NDP (28%). It is worth noting that the CPC carried the popular vote in BC with 34% in 2019, compared to 26% for the Liberals and 24% for the NDP.
What Could Change?
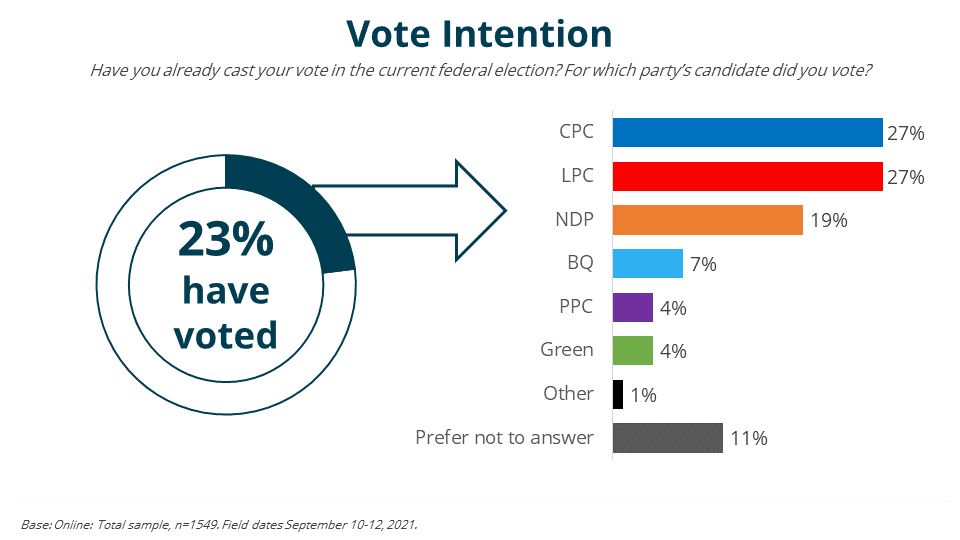
We were in field while advance polls were open (September 10-12) and among those we surveyed, 23% said they had already voted. Among those who have already voted, equal proportions have turned out for the Conservatives and Liberals (27% each) while 19% say they voted NDP.
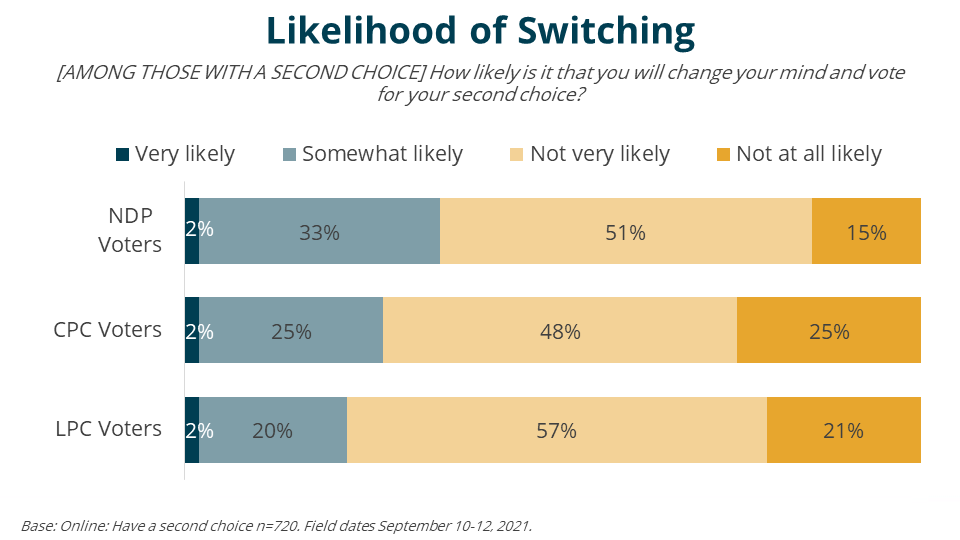
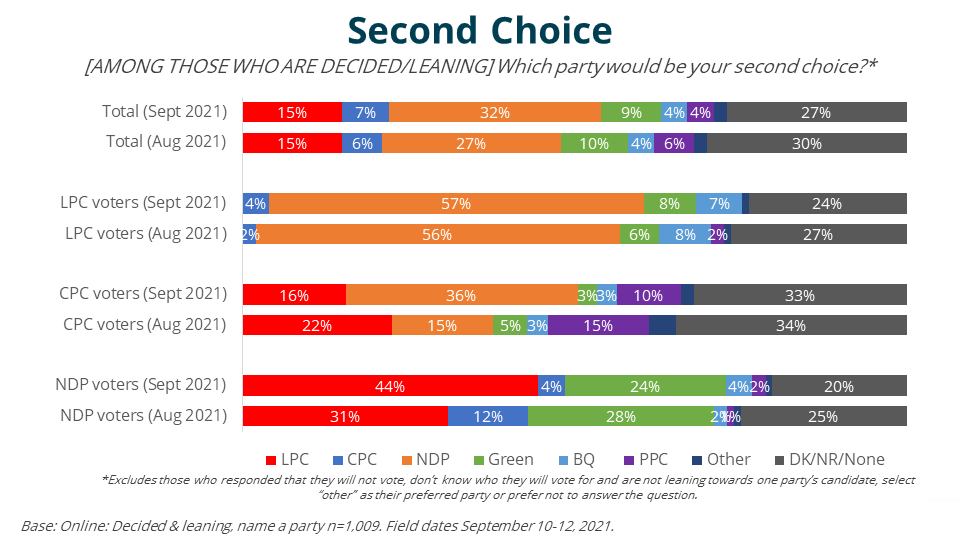
Shifts in support among those who have yet to vote could break the tie between the Liberals and Conservatives. We asked those who intend to vote for a party, but have a second choice, how likely they are to switch their vote. Of the three leading national parties, NDP voters are most likely to change their vote (35% very or somewhat likely), followed by Conservative voters (27%) and then Liberal voters (22%). The Liberals stand to gain the most from a shift in NDP support. Close to half (44%) of NDP voters say the Liberal Party is their second choice, compared to just 4% who say the Conservatives are their second choice. If NDP support does erode, it will likely benefit the Liberals.
Voting For vs. Against
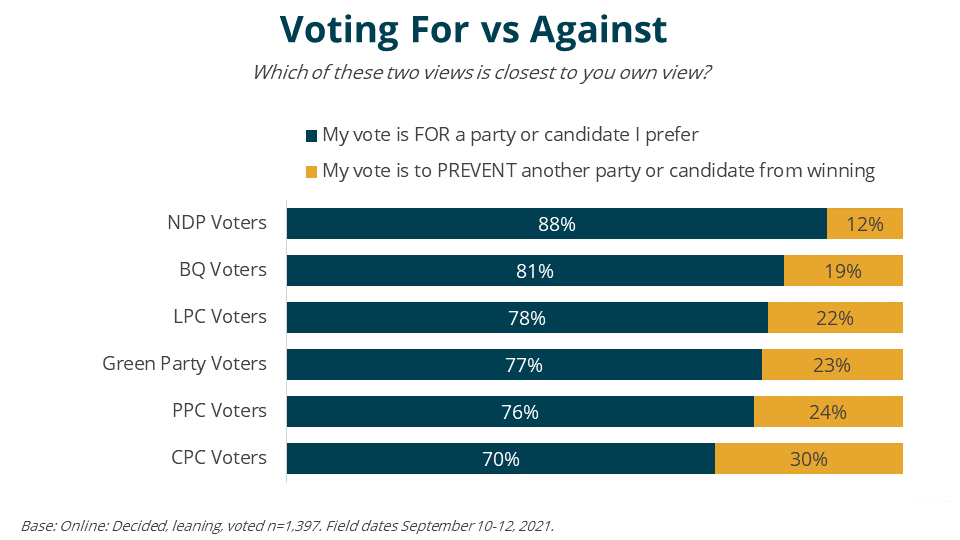
This week, we asked those who had voted or intend to vote if their vote is for a party or candidate they prefer, or if their vote is to prevent another party from winning. Presented with this binary choice, the vast majority of respondents say they are voting for a party or candidate they prefer. This view is most strongly held among NDP voters (88%), followed by BQ (81%) and Liberal voters (78%). Conservative voters are most likely to say they are voting to prevent a party or candidate from winning (30%), but even so, 70% claim they are voting for the party.
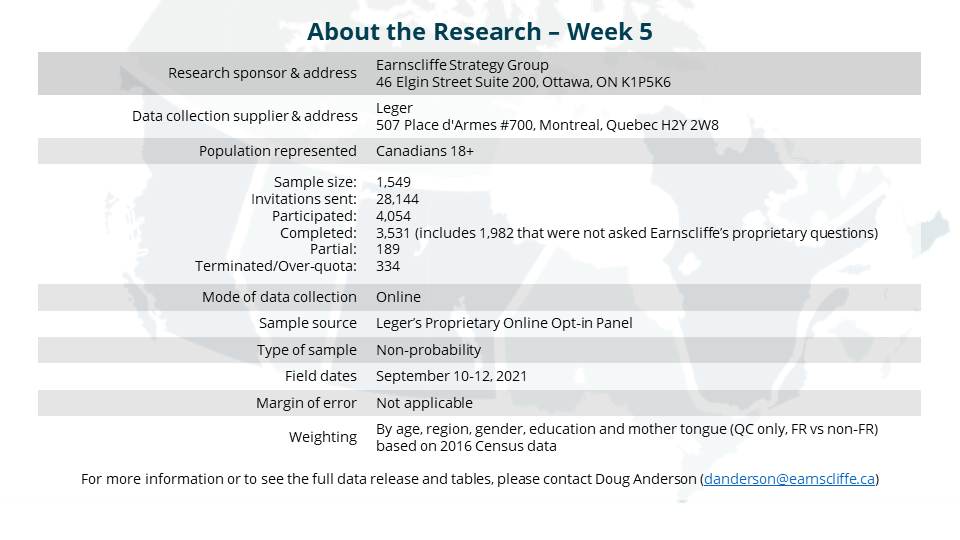
This survey was sponsored by Earnscliffe Strategy Group and conducted by Leger using a random sampling of panelists from Leger’s proprietary online panel. The survey was conducted with 1,549 individuals from across Canada between September 10 and 12, 2021. The data was weighted to be reflective of the Canadian population by age, region, gender, education and mother tongue (QC only, FR vs non-FR) based on 2016 Census data. Since this survey was conducted using an online panel, no margin of error may be calculated.
Earnscliffe follows the CRIC Public Opinion Research Standards and Disclosure Requirements that can be found here: https://canadianresearchinsightscouncil.ca/standards/
View the survey questionnaire | Download the full data tables
